Note: 21/06/2007 The Financial Year Time Series Spreadsheets previously omitted in the March quarter have now been added.
PRICE INDEXES AND CONTRACT PRICE INDEXATION
TAKE CARE in using seasonally adjusted and trend estimates. See Explanatory Notes paragraphs 37 to 45.
MARCH KEY FIGURES
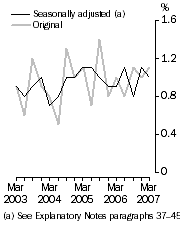
WPI-Quarterly changes,
Total hourly rates of pay excluding bonuses

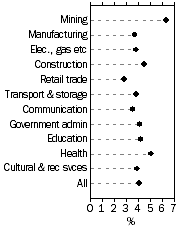
| WPI-Annual change: original,
Total hourly rates of pay excluding bonuses - For selected industries

|
MARCH KEY POINTS
TOTAL HOURLY RATES OF PAY EXCLUDING BONUSES
QUARTERLY CHANGE (DEC QTR 2006 TO MAR QTR 2007)
- The index for all employee jobs in Australia increased by 1.0%, seasonally adjusted.
- The increases in indexes (in original terms) at the industry level ranged from 0.1% for Communication services to 1.7% for Education.
- Increases in the indexes (in original terms) at the occupation level ranged from 0.9% for Professionals to 1.3% for Elementary clerical, sales and service workers and Labourers and related workers.
ANNUAL CHANGE (MAR QTR 2006 TO MAR QTR 2007)
- The increase in the seasonally adjusted index through the year to March 2007 for all employee jobs in Australia was 4.1%.
- Increases in the original indexes through the year to March 2007 at the industry level ranged from 2.8% for Retail trade to 6.3% for Mining, compared with 4.1% for all industries.
NOTES
FORTHCOMING ISSUES
| ISSUE (QUARTER) | Release Date |
| June 2007 | 15 August 2007 |
| September 2007 | 14 November 2007 |
| December 2007 | 20 February 2008 |
CHANGES IN THIS ISSUE
(1) Telstra Corporation was effectively privatised on 20 November 2006. For the purpose of ABS statistics this change from public sector to private sector is effective from March quarter 2007. This change has impacted on the data series presented in this publication.
The expenditure weights used to produce the labour price indexes are regularly updated once a year for the December quarter to take account of changing employer expenditure patterns for labour. As a result of the change of sector for the Telstra Corporation the expenditure weights have been updated for the March quarter 2007. The opportunity was also taken to price update all of the weights in the index. The new weights are provided in Appendix 1 Distribution of expenditure on wages and salaries.
For more information about the statistical treatment of Telstra in ABS outputs, please see ABS Information Paper: Future Treatment of Telstra in ABS Statistics (cat. no. 8102.0) released 26 February 2007.
(2) The Appendix on the Treatment of Bonuses and Commissions in the LPI is no longer included in this publication. It can be found in any of the 2006 issues of Labour Price Index (cat. no. 6345.0).
ABS DATA AVAILABLE ON REQUEST
Original indexes are compiled for various combinations of state/territory, sector, broad industry group and broad occupation group. Seasonally adjusted and trend indexes are compiled only for total hourly rates of pay excluding bonuses for each of the private sector, public sector and all sectors. Indexes not included in this publication may be made available on request by telephoning David Taylor on Perth (08) 9360 5151.
FURTHER INFORMATION
More detailed information on the Labour Price Index (LPI) is available in Labour Price Index: Concepts, Sources and Methods, Australia (cat. no. 6351.0.55.001).
INQUIRIES
For further information about these and related statistics, contact the National Information and Referral Service on 1300 135 070 or David Taylor on Perth (08) 9360 5151.
COMMENTARY
NATIONAL MINIMUM WAGE INCREASES
The Australian Fair Pay Commission (AFPC) has had responsibility for setting federal minimum wage rates since early 2006. The first ruling by the AFPC had a date of effect of 1 December 2006 which was after the quarterly survey reference date for the December quarter 2006 Labour Price Index Survey.
The AFPC ruling had a negligible impact on the wage price index for the December quarter 2006. However pay changes attributed to the AFPC ruling were reported by a number of employers in the March quarter 2007. The proportion of sampled jobs reporting pay increases was higher in the March quarter 2007 than for the March quarter 2006, particularly in the private sector.
SEASONALLY ADJUSTED ESTIMATES
The recent industrial relation changes, including the date of effect of the first AFPC ruling, have affected the seasonally adjusted and trend estimated for the wage price index. In calculating the seasonally adjusted estimates the ABS applied both a trend and a seasonal break to the September quarter 2006 seasonally adjusted estimates, and a further trend break has been applied to the Private sector seasonal estimates for the March quarter. For further details, see paragraphs 37-45 of the Explanatory Notes.
INDUSTRY
In original terms, the industries with the highest rates of increase through the year to March quarter 2007 were Mining (6.3%) and Health and community services (5.1%). The lowest rates of increase were reported in the Retail trade (2.8%) and Accommodation, cafes and restaurants (2.9%).
STATE
In original terms, the states with the largest changes through the year were Western Australia (4.8%), Queensland (4.5%) and Tasmania (4.5%).
There was comparatively little variation in the March quarterly change at state level, with all states recording an increase of 1.1% except for South Australia (1.2%) and Tasmania (1.4%).
 Print Page
 Print All